.svg)
View all articles
Politics
Analysis of college voting behavior, program efficacy, and opportunities to increase student voter participation
February 9, 2026
Lorem ipsum dolor sit amet, consectetur adipiscing elit. Suspendisse varius enim in eros elementum tristique. Duis cursus, mi quis viverra ornare, eros dolor interdum nulla, ut commodo diam libero vitae erat. Aenean faucibus nibh et justo cursus id rutrum lorem imperdiet. Nunc ut sem vitae risus tristique posuere.
Findings draw from four distinct data sources: (1) voter file matching of 758,000 student records from 276 colleges and universities in swing states; (2) analysis of 100 campus precincts in battleground states; (3) an aggregate of 36,568 student survey responses collected between April and November 2024; and (4) surveys, interviews, and listening sessions with 100 campus organizing program managers and staff. Data collection and analyses conducted by flytedesk and Pantheon Analytics. Download College Vote 2024 Toplines.
College students were an outsized presence in the 2024 electorate. They made up 39% of the 18-24 population but accounted for 48% of voters in that age group. At the same time, registered student turnout at battleground state universities dropped 6 percentage points from 2020 — from 83% to 77% — a meaningful decline in a competitive election cycle.

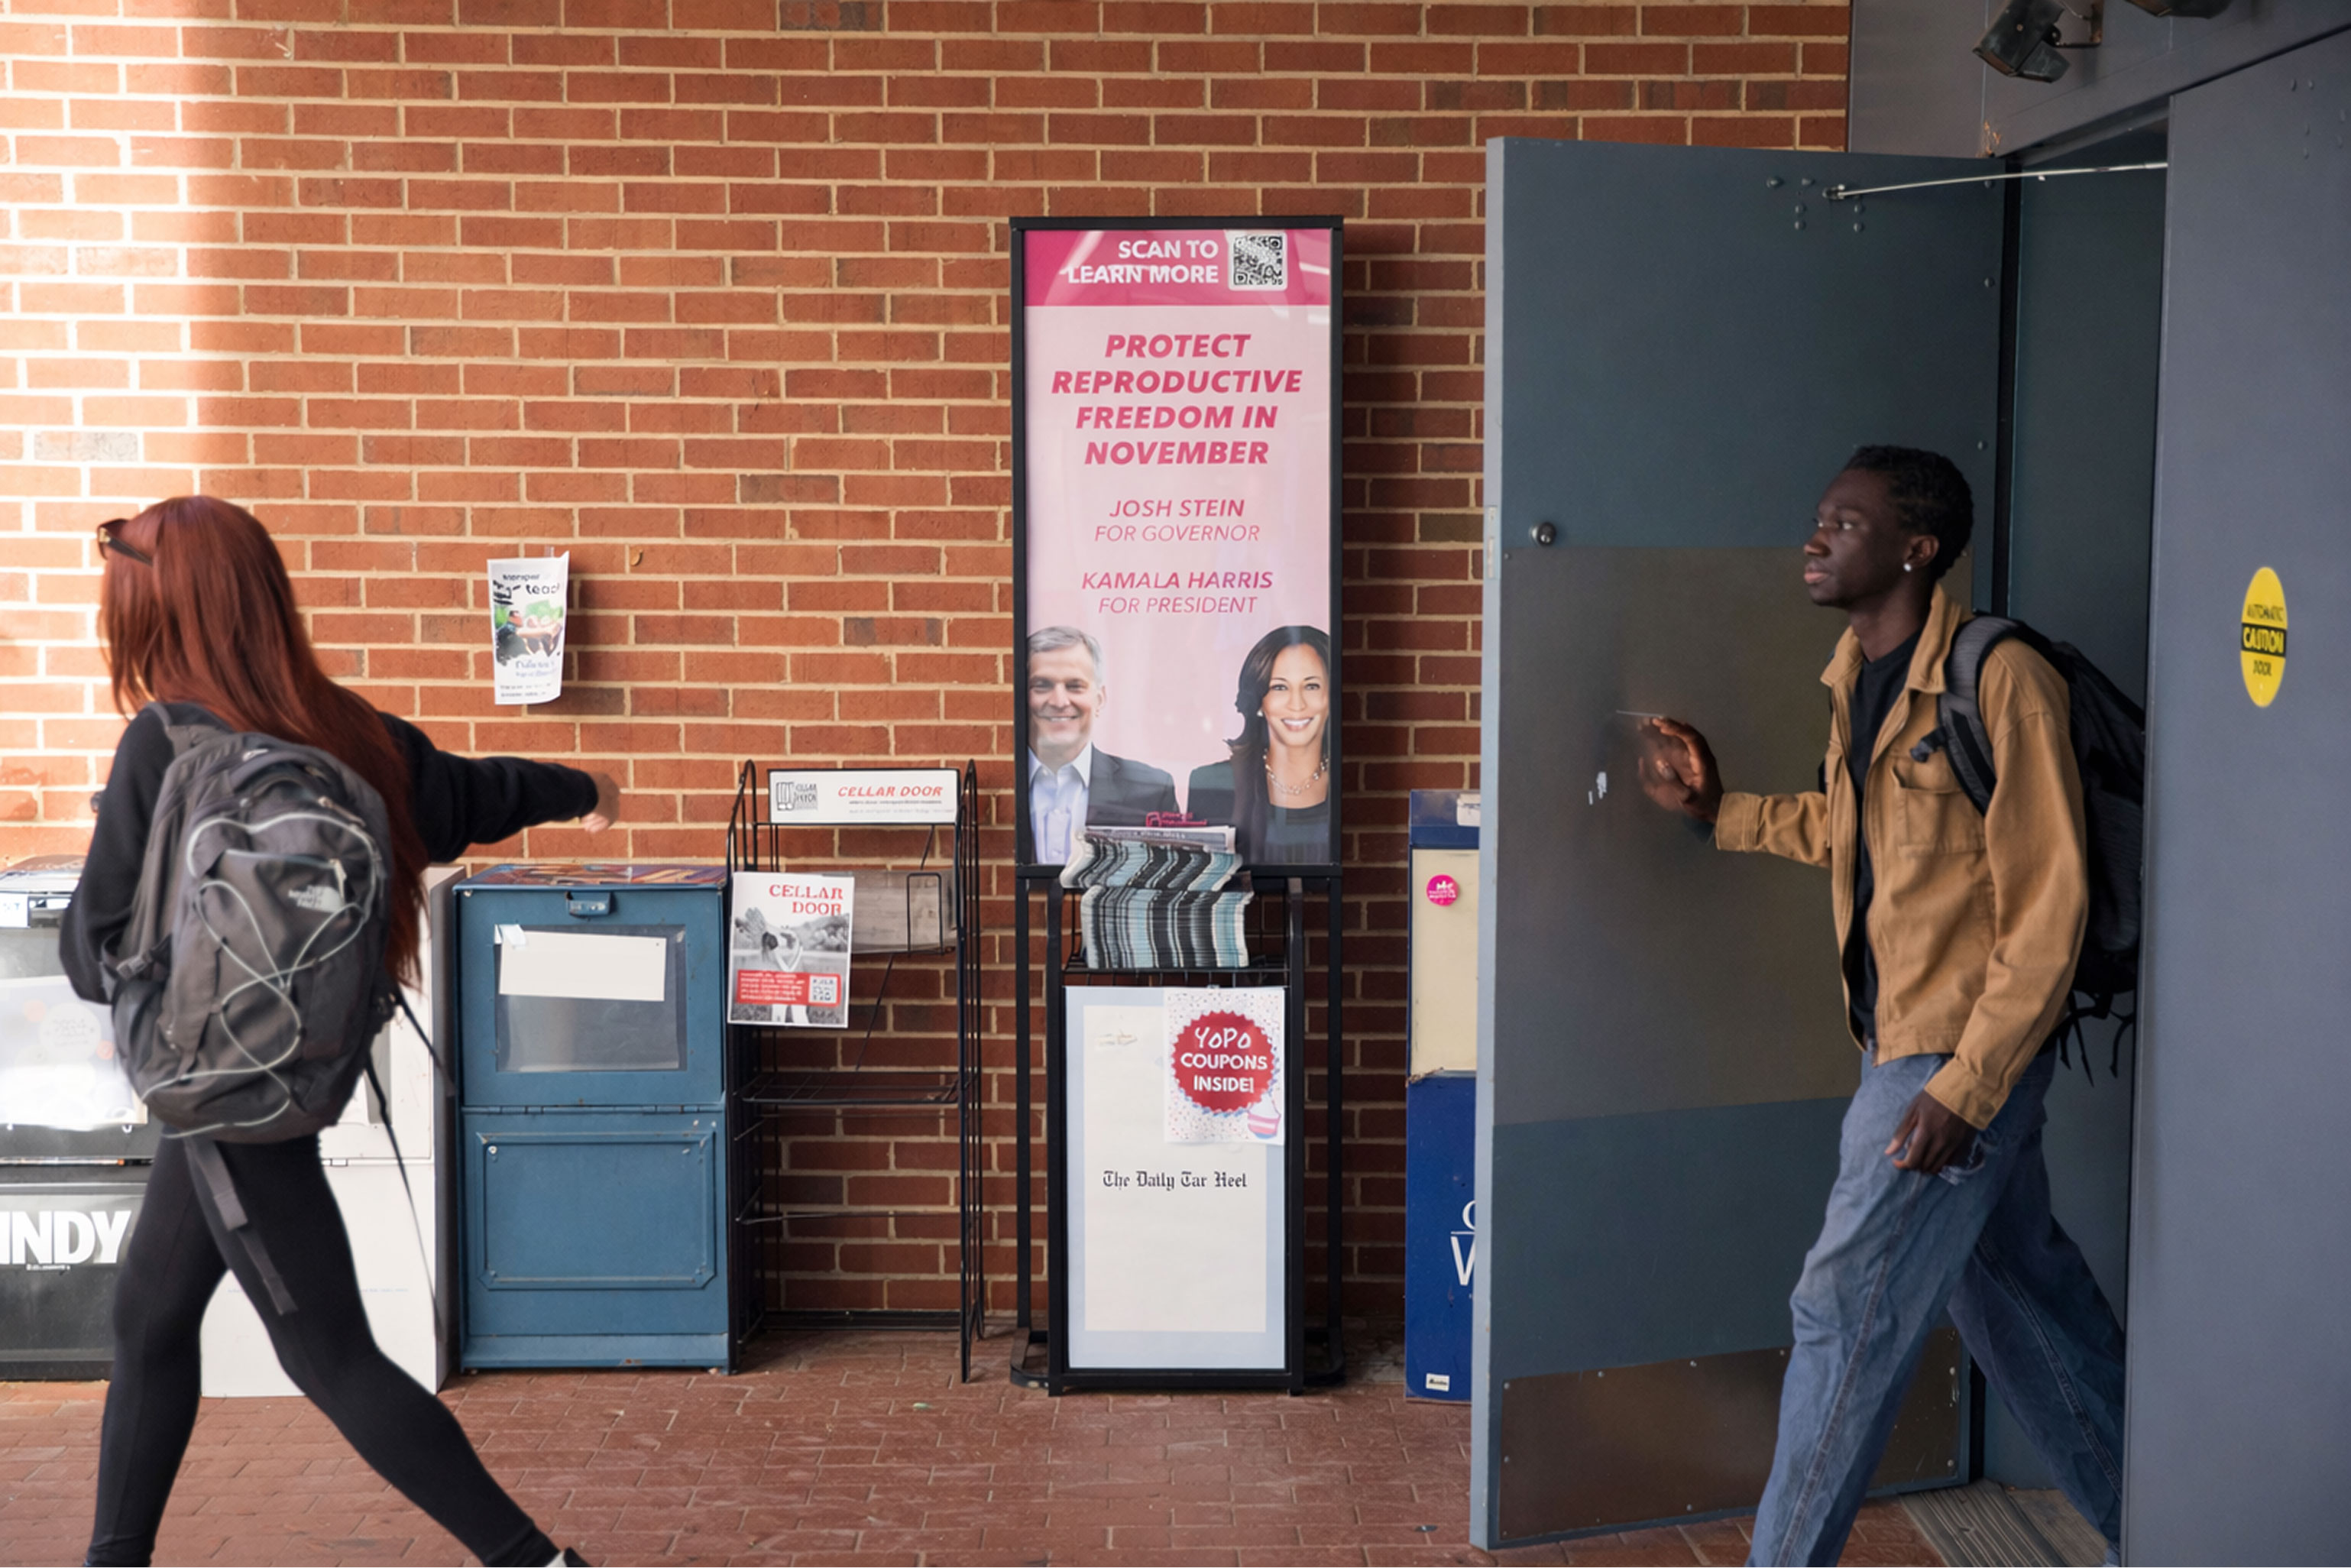
Out-of-state students were 9pp more likely to vote if registered with their campus address. Students exposed to high-saturation on-campus registration ads through the flytedesk platform were 12pp more likely to register with their campus address. Students exposed to GOTV ads were 7pp more likely to vote.
Kamala Harris received 78% of students’ vote share head-to-head against Trump, down 2 points from Biden’s 80% in 2020. Only 1.5% of voters cast their 2024 presidential ballot for someone other than Kamala Harris or Donald Trump – slightly less than the 1.9% who did so in 2020 in those same precincts.

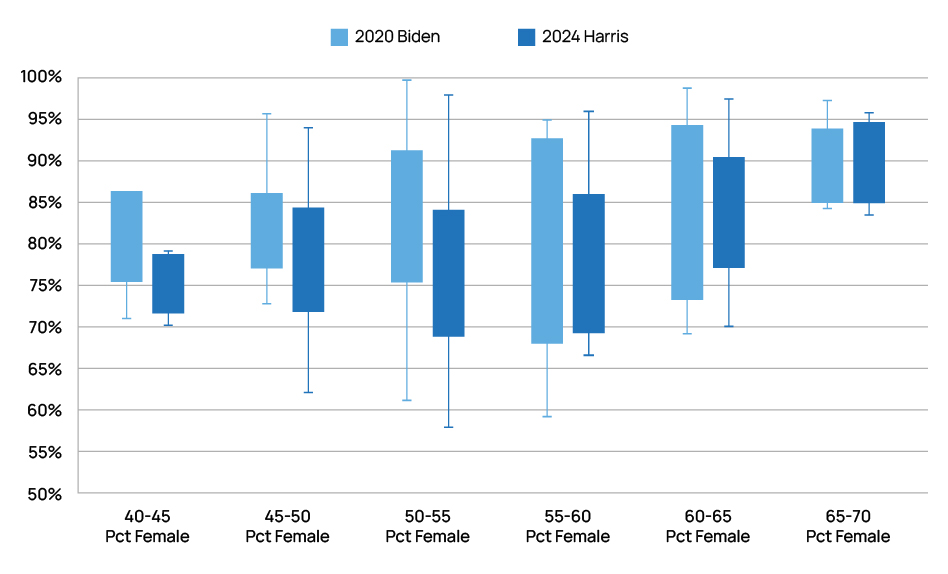
3.1 Gender: Across college precincts, there was a near-monotonic relationship between Harris’s share of the vote and how female-heavy the precincts were. This chart shows the range of Harris and Biden vote shares for the precincts with similar boundaries across both elections, categorized according to how male-heavy the precinct was in 2024. Catalist and CIRCLE found similar increases in the gender gap among all young voters. However, the Center for American Women and Politics found a narrower gender gap. All of these analysis methods have strengths and weaknesses. Thus, it is difficult to know if the widening gender gap in the battleground college precincts observed is in line with, or stands in contrast to, the trends that young voters exhibited more broadly.
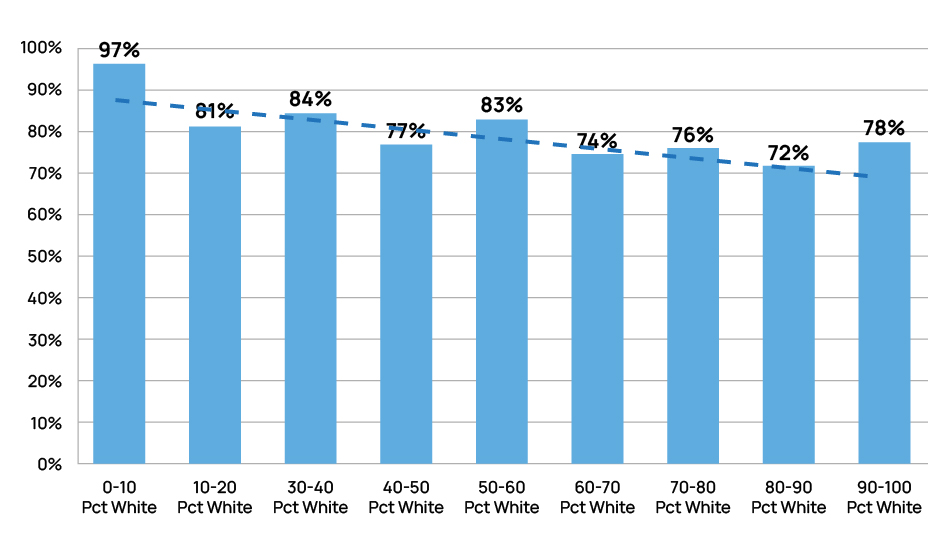
3.2 Race: Across racial composition, Democratic vote share held broadly across all precinct types. Even the precincts with the highest proportions of white voters gave the Democratic nominee at least 70% of the two-party vote, well above the rate observed for the same age group in the general population.
3.3 School Selectivity: School selectivity showed only a modest relationship with partisanship. The most selective schools did vote Democratic at slightly higher rates, but even precincts covering the least selective schools voted Democratic at 73%; these findings are consistent with the general electorate, where educational attainment is a strong predictor of partisanship.
3.4 Age and Class Year: Differences in turnout between the oldest and youngest students were minimal for both turnout and partisanship.
flytedesk surveyed over 36,000 students across the 2024 election cycle to track how student priorities shifted over time. The top four issues heading into November were the economy, reproductive rights, healthcare costs, and protecting democracy. This represents a notable shift from 2022, when the top issues were racial justice, reproductive rights, the economy, and climate change.
The economy and reproductive rights remained consistent anchors throughout the cycle, but their relative weight shifted month to month. Campus organizers, in separate interviews and surveys, reported that the issue they heard about most frequently from students outside of the top survey issues was the conflict in Gaza, a divergence from findings in student surveys.

Student political preferences were more fluid in 2024 than historical patterns might suggest. When the Democratic presidential nominee changed in July, flytedesk surveys captured a 20-point drop in students choosing a third-party or alternative candidate, accompanied by a near-symmetric 22-point increase in students choosing the Democratic nominee. Preference for the Republican nominee remained relatively stable throughout.

Candidate favorability followed a similar arc: from July to November, the Democratic nominee saw a 3-point rise in overall favorability and a 12-point increase in "very favorable" ratings. The Republican nominee showed less variability across the same period.

flytedesk surveyed 75 campus organizing program managers and staff, conducted 31 interviews, and held 4 listening sessions. Their observations add context that survey data alone cannot capture.
Organizers reported that campaign communication (ads, candidate statements, and social media) resonated only moderately with students. On a scale of 0 to 10, the average score for how well communication resonated was 5.3. Their confidence that students understood candidates' platforms on issues they cared about averaged 5 out of 10.
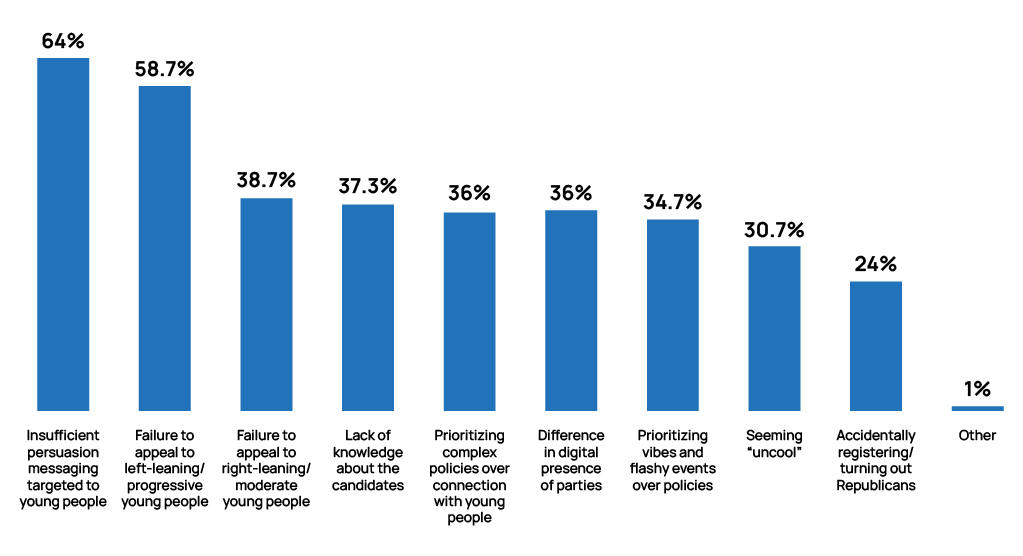
When asked to identify factors that explained lost ground with students, organizers most frequently cited insufficient persuasion messaging targeted to young people (64%) and failure to appeal to left-leaning young people (58.7%).
Organizers also identified what worked. On the ground, the most effective tactics were tabling, high-traffic canvassing, and capacity-building events, particularly when paired with speakers, giveaways, or food. At the program level, starting early, targeting a broad range of campuses beyond large public universities, and investing in staff development were consistently cited as success factors.
The clearest takeaway from organizers were: (1) students should be treated as a persuasion audience, not just a mobilization target; (2) they respond to substance and authenticity; and (3) have many competing priorities for their time.
These and addition figures about the college vote are also summarized in flytedesk's college student statistics library.

On this page
Headings

.avif)

%202.svg)