.svg)
View all articles
Back-to-school
Back-to-college spending reached $88.8 billion in 2025, but it doesn't happen all at once. flytedesk data shows three distinct buying windows, and a summer-only campaign misses two out of three.
July 8, 2026
Lorem ipsum dolor sit amet, consectetur adipiscing elit. Suspendisse varius enim in eros elementum tristique. Duis cursus, mi quis viverra ornare, eros dolor interdum nulla, ut commodo diam libero vitae erat. Aenean faucibus nibh et justo cursus id rutrum lorem imperdiet. Nunc ut sem vitae risus tristique posuere.
Back-to-college spending reached $88.8 billion in 2025, up from $86.6 billion in 2024 and roughly $67.7 billion in 2020. Per-student spending has risen from $599 in 2008 to $1,326 in 2025, more than double the pace of inflation (National Retail Federation, Back-to-College Data Center, 2025).
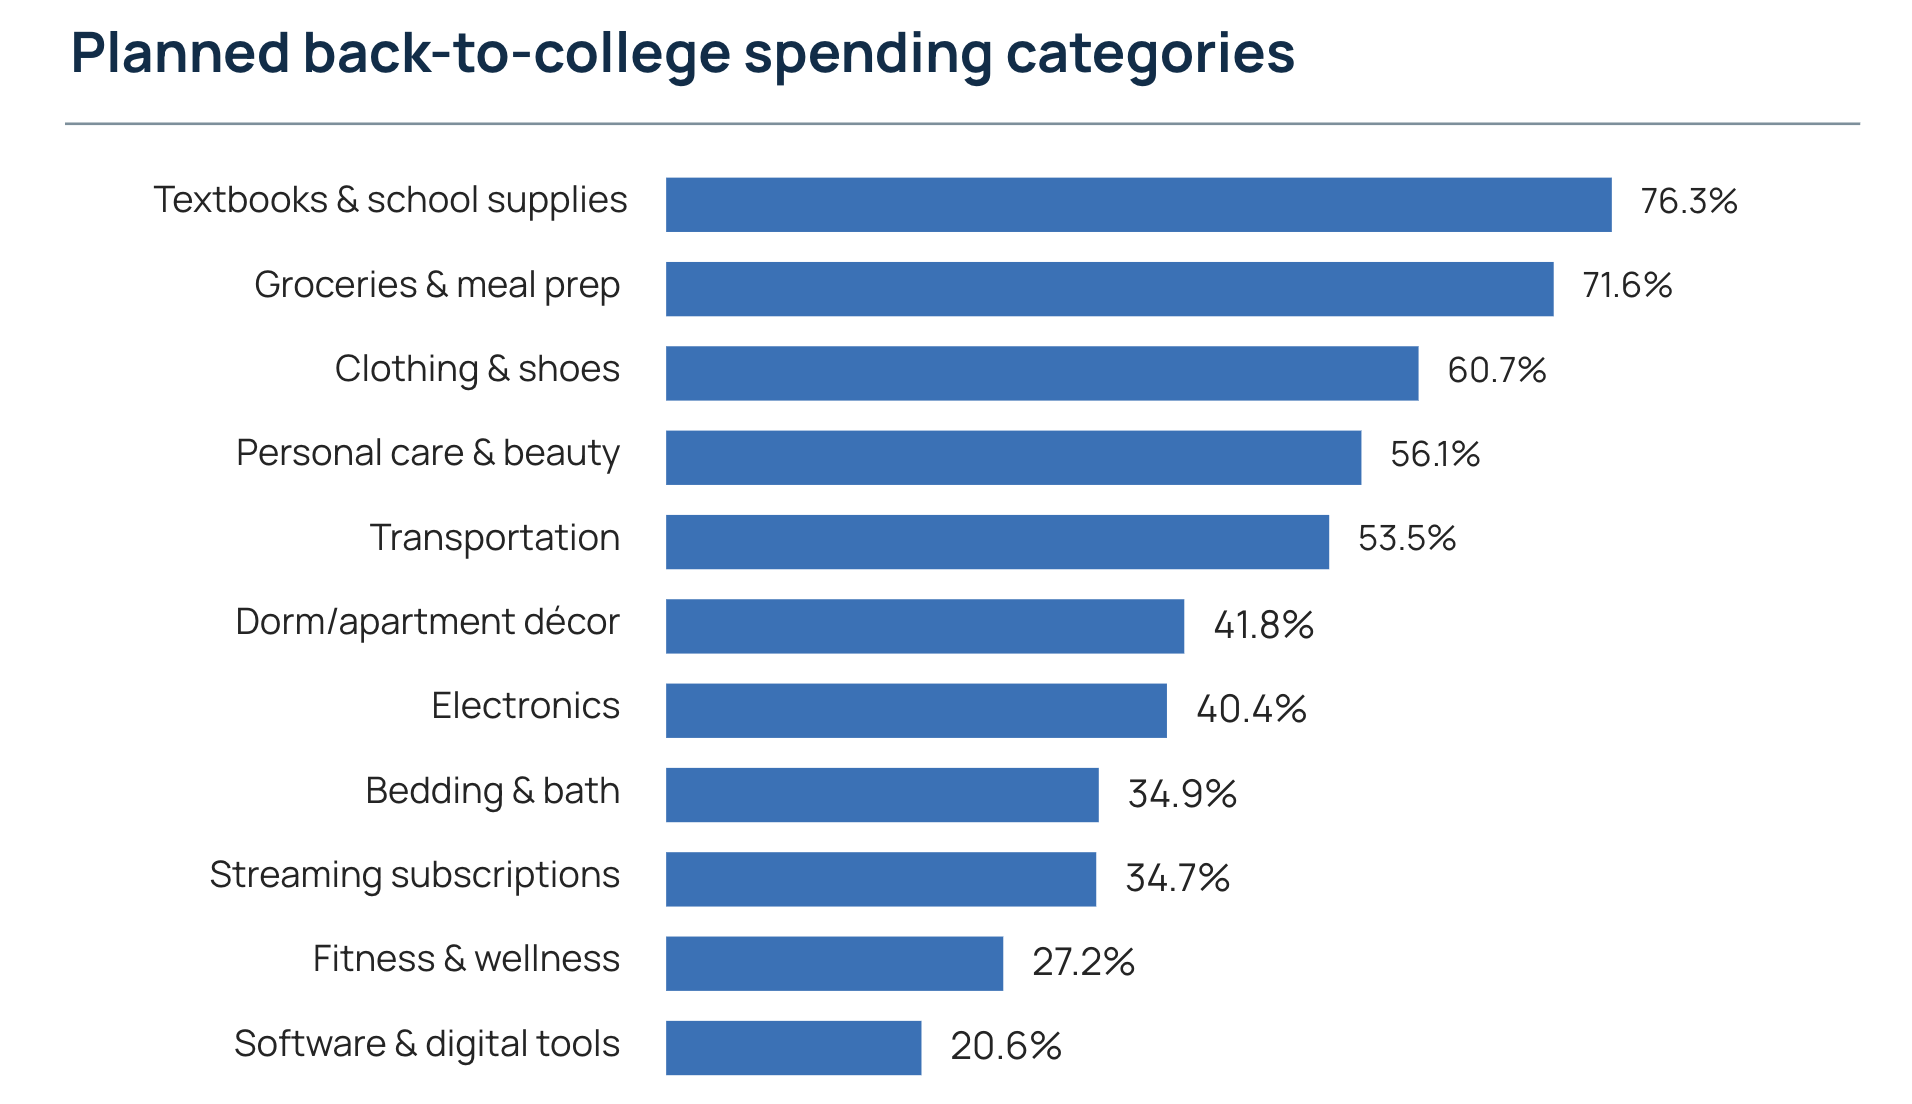
The increase reflects the expanding scope of what students now consider college essentials. New categories have entered the mix, like streaming subscriptions and software and digital tools, that would not have appeared on a back-to-college list a decade ago.
The conventional summer shopping season is only part of the picture. flytedesk research reveals three distinct purchase windows: before campus arrival (electronics, bedding), move-in weekend (groceries, essentials), and post-arrival (textbooks, software, personal care).
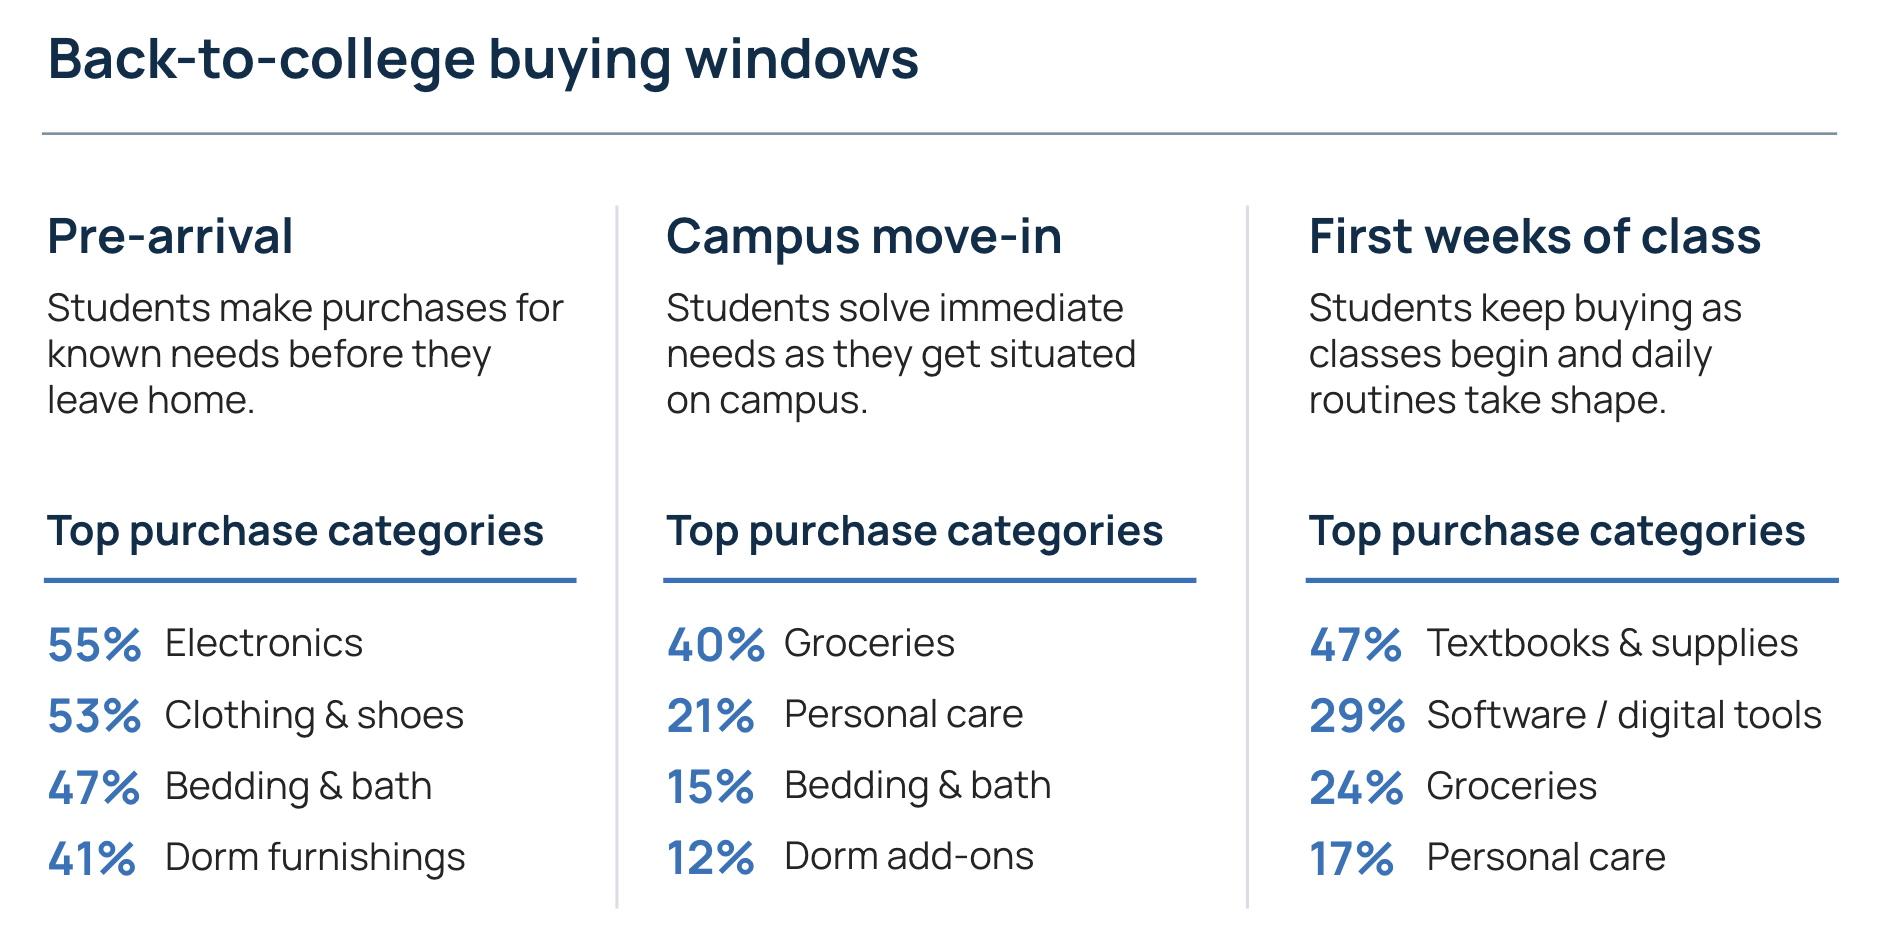
The post-arrival window is especially active and often underestimated. flytedesk research among incoming first-year students found that 99% make a trip for core back-to-school items like groceries, personal care products, and school supplies after move-in, not before.
99% of students buy core back-to-school items like groceries, personal care products, and school supplies after move-in.
Students' go-to retailers are practical and high-convenience. Amazon leads by a wide margin, named among the top three back-to-college shopping destinations by 72.8% of students, followed by Walmart at 56% and Target at 31.7%.
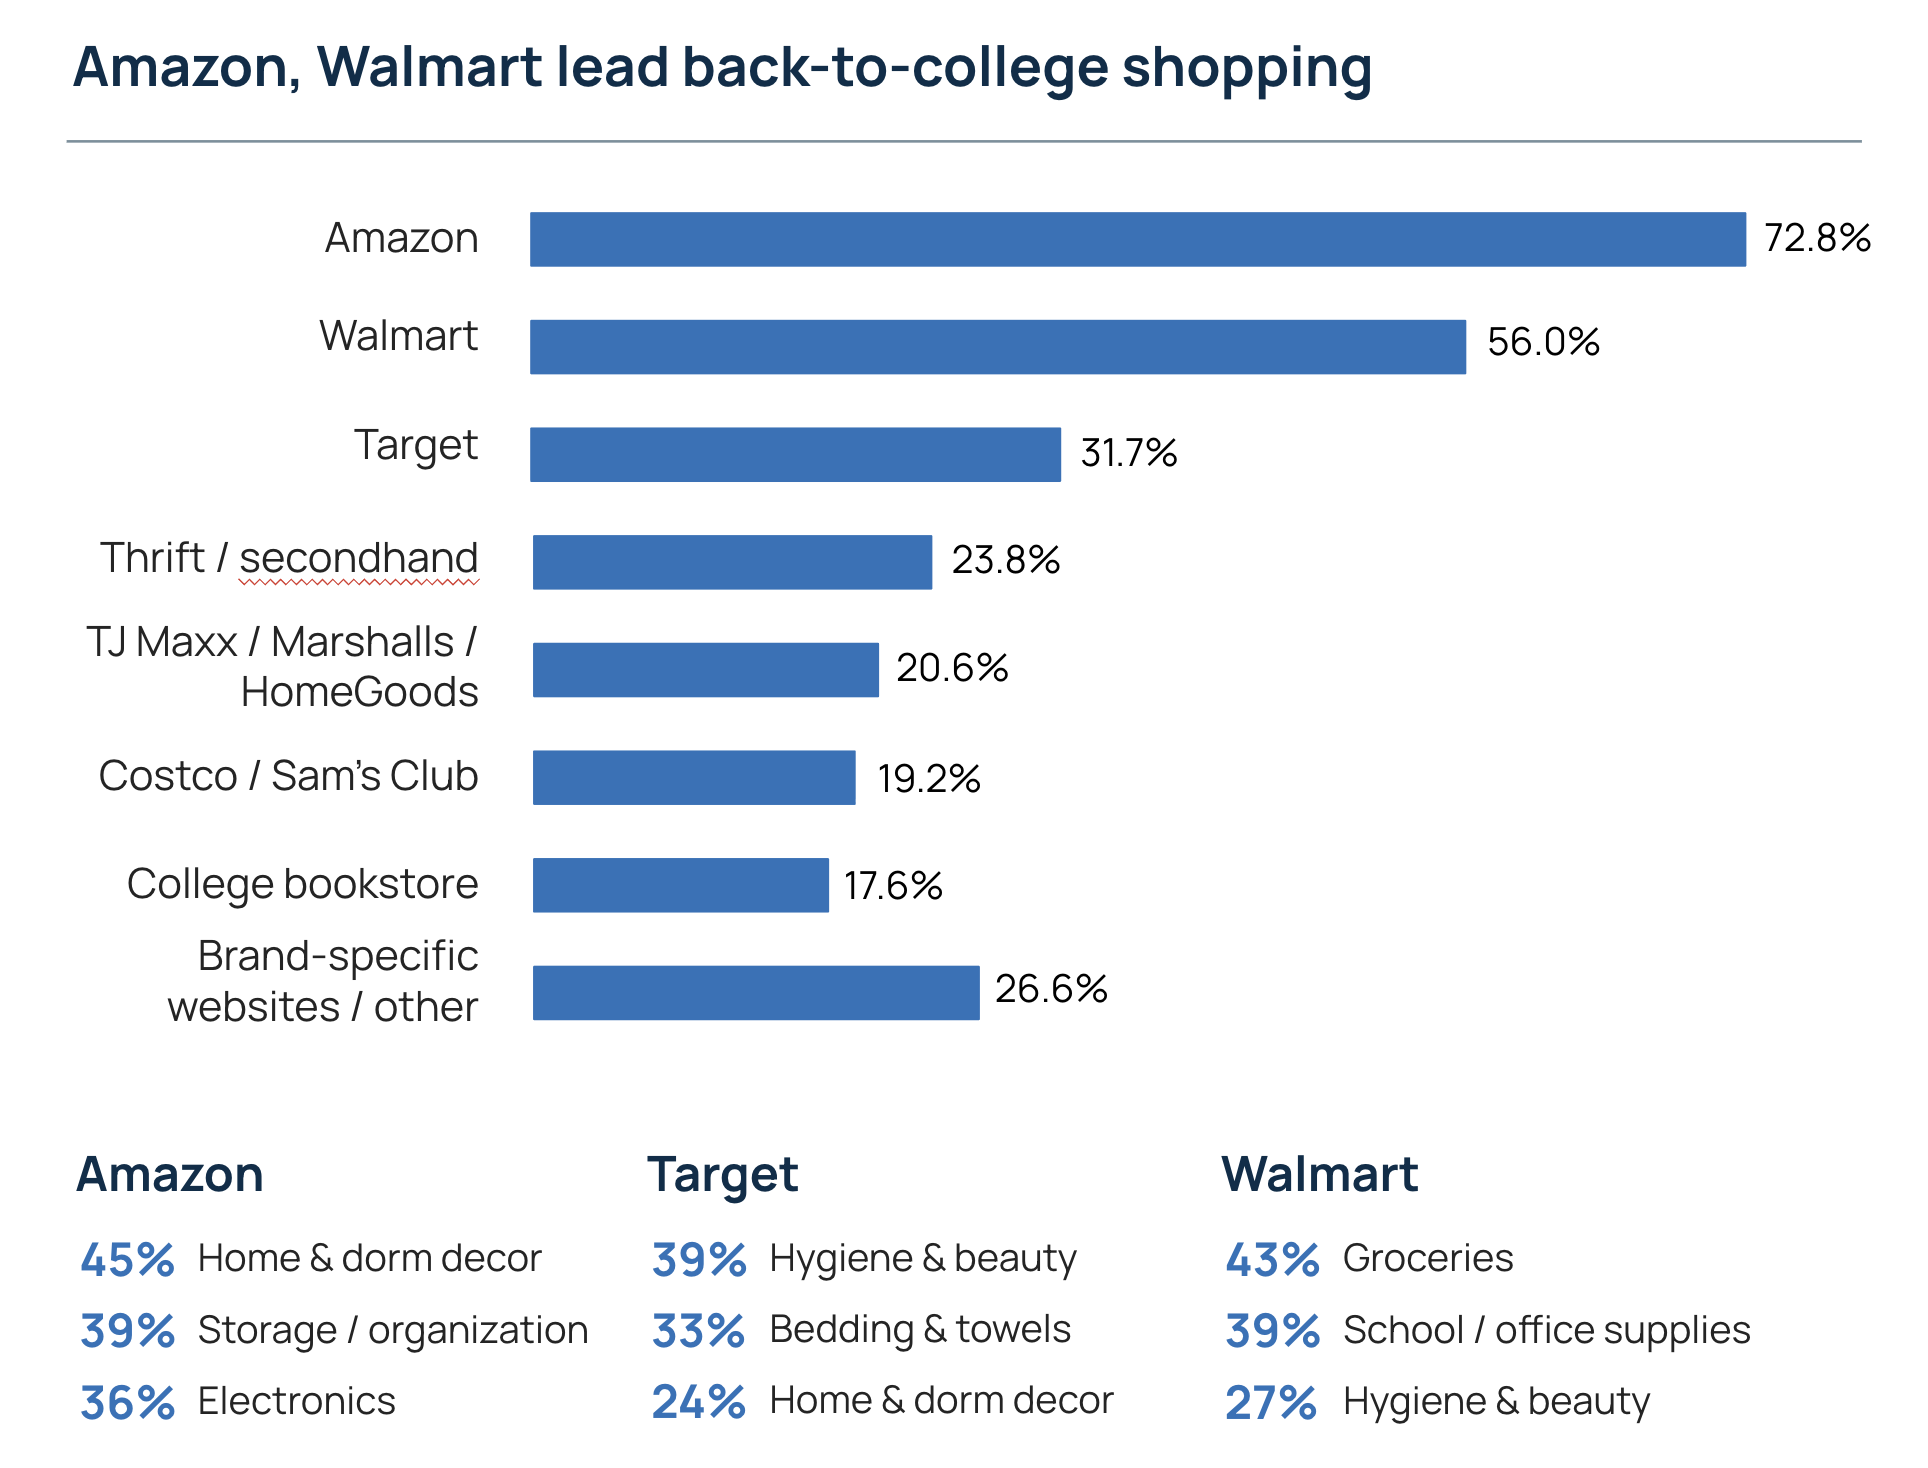
Amazon's position at the top of the overall retailer ranking is real, but it understates how deliberately students route between stores by category, Amazon leads dorm décor and electronics, Target leads hygiene and bedding, and Walmart leads groceries and school supplies.
Quality, cost, and aesthetics all factor into student purchases, but the weighting shifts significantly by category. Notably, groceries are the only category where more than 50% of students name cost as their primary driver.
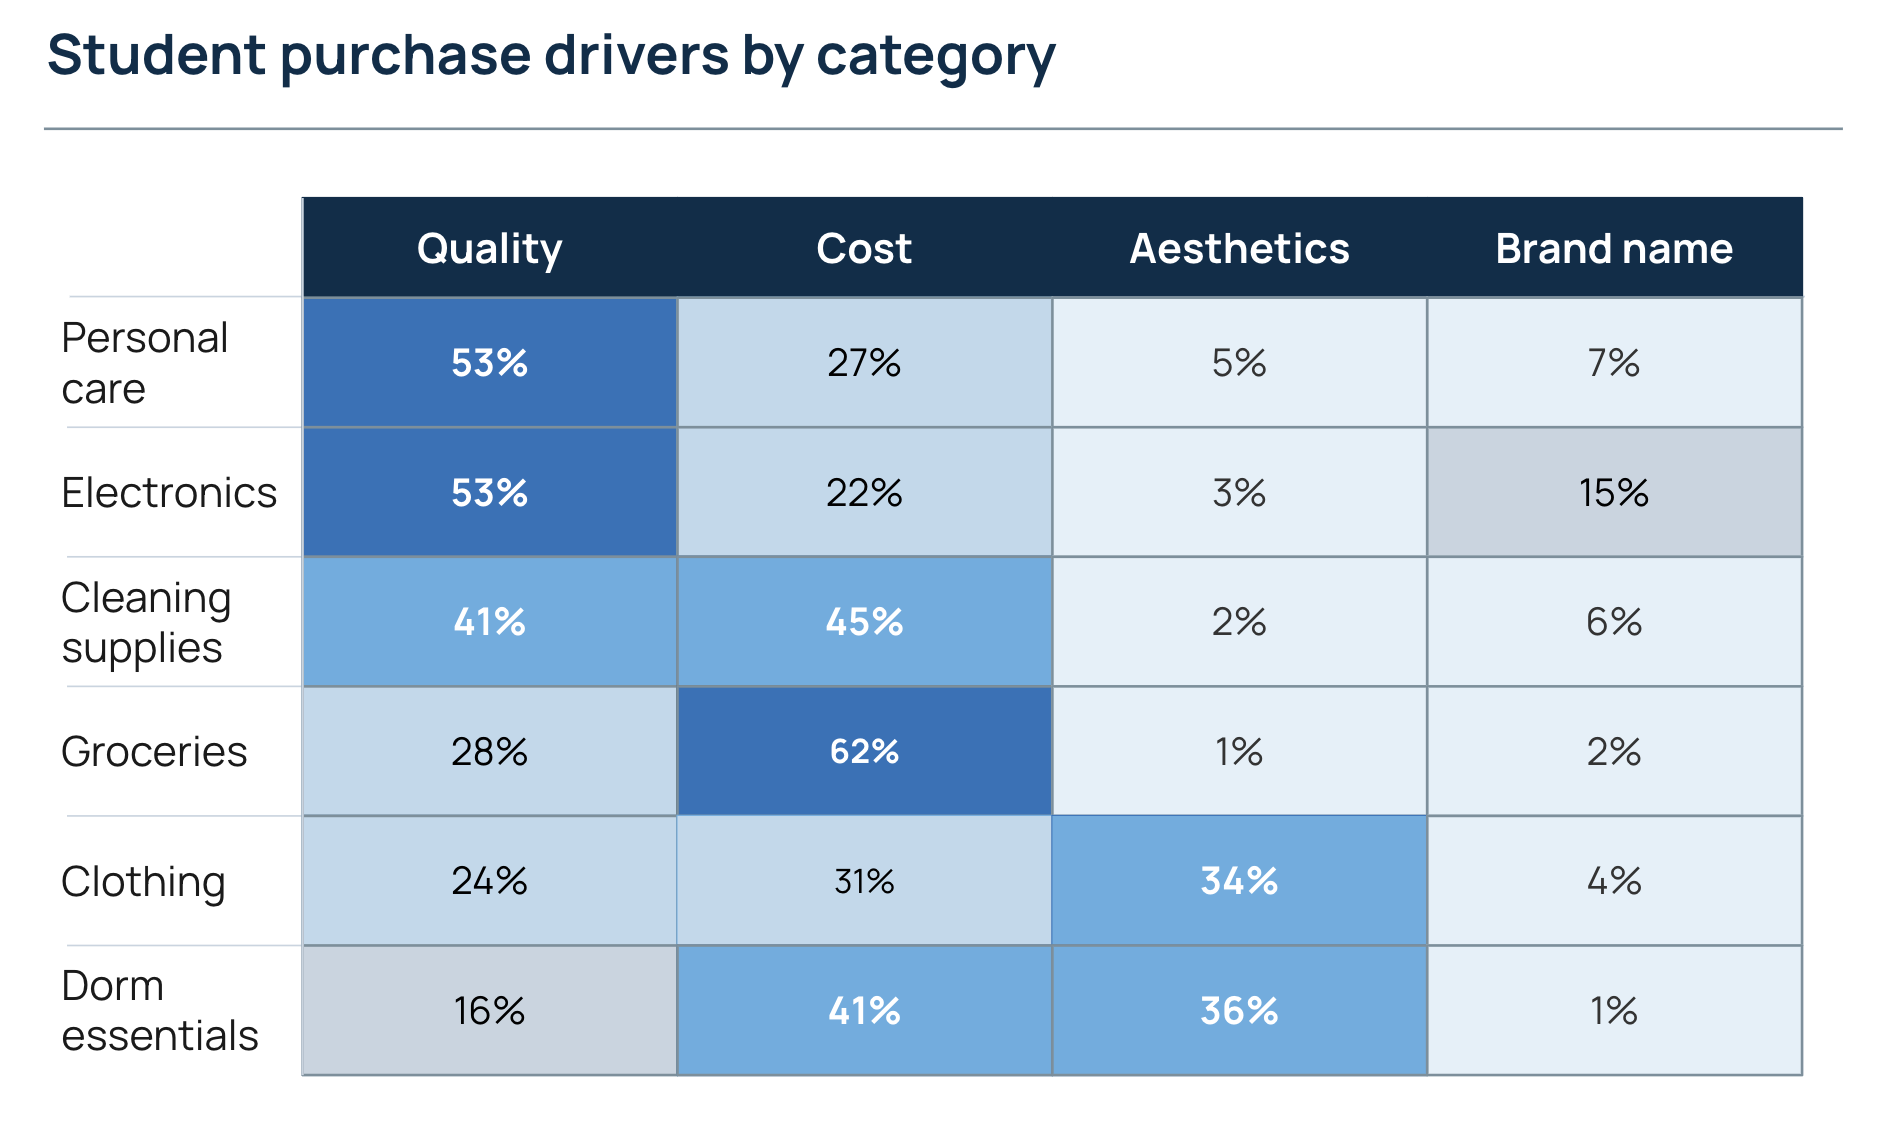
Brand name ranks last or near-last in every category, never breaking above 15%. But stated preference and actual behavior diverge here: flytedesk research finds that students are measurably more likely to buy the brands they believe their peers are using, a gap we'll explore in an upcoming article.
See flytedesk's college student statistics library for additional back-to-college benchmarks, including retailer preference and purchase timing data.

On this page
Headings

.avif)

%202.svg)